Unlocking Observability in Enterprise Inference: A Cloud2 Labs Developer Journey

At Cloud2 Labs, we’re constantly exploring ways to make AI/ML systems more transparent, measurable, and actionable. Recently, our team focused on enhancing observability in our GenAI inference stack leveraging the built-in capabilities of the platform rather than building custom solutions from scratch.
This blog outlines our experience activating and validating Langfuse and LiteLLM telemetry, generating traces from deployed models, and creating dashboards that translate raw metrics into actionable insights for both engineering teams and leadership.
Understanding the Opportunity
Deploying GenAI models comes with inherent complexity: multiple models, high compute workloads, and varying request patterns. To make data-driven decisions, we needed to answer questions such as:
- Which models respond fastest?
- How consistent are their outputs under load?
- How efficient is token processing?
- Where do latency spikes or failures occur?
The good news: the inference stack already exposes observability hooks for these metrics. Our challenge was to enable them, validate the telemetry, and use it effectively.
Activating Built-In Observability
Deploying GenAI models comes with inherent complexity: multiple models, high compute workloads, and varying request patterns. To make data-driven decisions, we needed to answer questions such as:
- Which models respond fastest?
- How consistent are their outputs under load?
- How efficient is token processing?
- Where do latency spikes or failures occur?
The good news: the inference stack already exposes observability hooks for these metrics. Our challenge was to enable them, validate the telemetry, and use it effectively.
Generating and Capturing Traces
With observability active, we routed requests to the GenAI models through LiteLLM. This automatically generated detailed traces, including:
- Model identifiers
- Input/output token counts
- Time to First Token (TTFT)
- E2E Latency
- Error and retry metadata
These traces were ingested into Langfuse in real time, providing a comprehensive view of model performance and system behavior.
Exploring Metrics with Langfuse
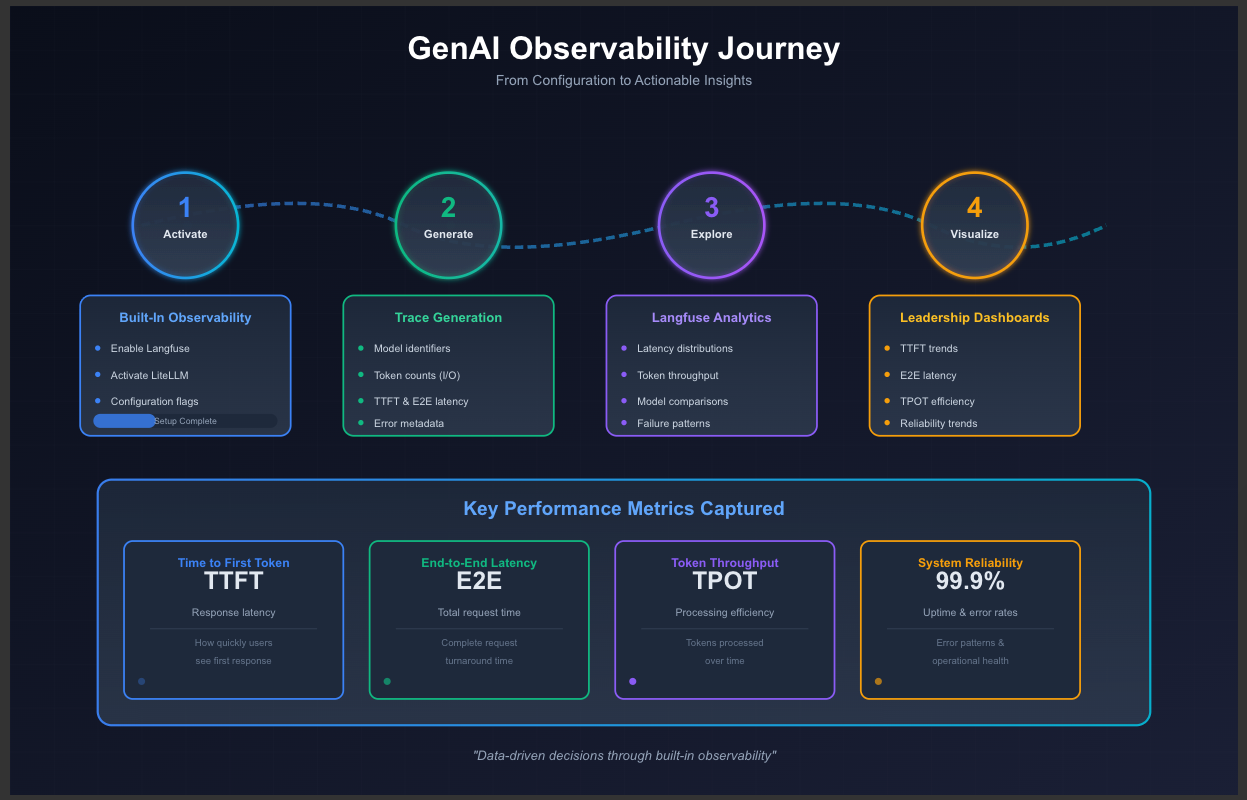
Once traces were flowing, we explored the data using Langfuse’s built-in dashboards:
- Latency distributions across models
- Model-level performance comparisons
- Failure patterns and anomalies
This exploration highlighted patterns that were critical for performance tuning, capacity planning, and model selection.
Creating Leadership-Focused Dashboards
To make telemetry actionable for decision-makers, we built dashboards visualizing:
- TTFT trends – how quickly users see responses
- E2E latency – total request turnaround time
- Model comparisons – identifying high-performance candidates
- Error and reliability trends – pinpointing operational bottlenecks
These dashboards bridged the gap between engineering insights and strategic decision-making, providing leadership with a clear picture of model efficiency, reliability, and scalability.
Lessons Learned
Through this journey, we realized:
- Built-in observability is powerful – the stack provides everything needed to monitor and analyze GenAI models.
- Our role is to enable, validate, and consume – configuration, trace generation, and dashboarding are sufficient to gain actionable insights.
- Data drives confidence – decision-making for model selection, scaling, and operational improvements becomes objective, measurable, and repeatable.
Tips for Teams Enabling Observability
Enabling observability in Enterprise Inference stack is straightforward, but getting real value from it requires a bit of intentional setup and validation. Based on our experience activating Langfuse and LiteLLM telemetry, here are practical tips to help teams get the most out of the platform:
- Most access issues come down to missing host file entries or ingress not being reachable. Confirm these before troubleshooting deeper layers of the stack.
- Before building the dashboards, use the LiteLLM UI to send a few test requests and confirm that traces appear in LangFuse.
- Use built-in LangFuse widgets before creating custom ones
- After real traffic accumulates, validate that the dashboards that reflect your intended insights and refine them based on emerging patterns
What’s Next
With the observability framework activated and dashboards in place, we now have a foundation for:
- Automated model evaluation pipelines
- Continuous monitoring and regression detection
- Cost-performance optimization
- Multi-model A/B testing with metrics-backed decisions
By leveraging the stack’s existing telemetry capabilities, Cloud2 Labs can operate GenAI systems more efficiently, transparently, and intelligently—without reinventing the wheel.